


Diesel Floaters: The Essential Element for Keeping Freight Transports Moving
Different regions, different approaches - One goal

In one of our recent articles, we examined the role of fuel in overall transportation costs and the factors that influence it. Given that diesel is one of the most important but also the most volatile cost factor at the same time, measures are needed to shield both shippers and carriers from this external impact. This was particularly evident at the start of 2022 when unprecedented price peaks occurred due to Russia's invasion of Ukraine. During this period, it was crucial to support carriers to maintain their operations and prevent them from bankruptcy. In today’s article, we will explore various methods of setting up such diesel floater mechanisms, as well as potential advantages and drawbacks.
The European Way to diesel change management
In our long history of working with shippers and observing their procurement methods in the market, we have encountered similar strategies for handling fuel price fluctuations in Europe. Predominantly, shippers stipulate the terms & conditions, which carriers must confirm to get access to the tender documents. The varied approaches are primarily based on three elements:
Fuel index
Fuel share
Update frequency
The fuel index is the source, which tracks the diesel development. An often used index is the European Commission`s Weekly Oil Bulletin, covering the gas station prices incl. all taxes in every European Union country. Besides, one can also choose from national indexes, such as France`s CNR (Comité national routier) or en2x in Germany, which also track diesel price changes. There are multiple ways to select the applicable diesel price for the respective transport. It could be based on the price of the transport`s origin country but also the European average price. The majority uses the EU27 average for all lanes for convenience, yet this approach may not capture all changes accurately.
Considered prices should exclude value-added taxes, as this tax can fluctuate over time, however, not all mentioned sources provide diesel prices excl. VAT.
The fuel share is the most critical element that can significantly influence the rate update. Usually, shippers set a comprehensive fuel share in the total price during the tender. It can be separated for road & intermodal transports to better reflect the fuel cost of the carrier. However, this approach has some limitations, considering the diversity in a shipper`s network (such as short/long-distance transports, service within low/high cost countries). The issues linked to that approach will be addressed later. The typical fuel share is set between 25-30% of total price.
The third major differentiator is the frequency of updates. Few shippers only update once a year or every half year. However, the majority updates the prices monthly or quarterly. In that process, the evolution of diesel price is compared against a base value. This comparison determines the percentage change, which is used for further calculations. Some setups use the actual percentage change, while others check if a certain threshold (e.g. 5% change to last base price) was reached. If not, the transport prices remain unchanged.
To illustrate the adaptation procedure, let´s do a simple calculation with fictional figures:

Source: Trimble Maps (PC*Miler), own calculation
Although this process seems straightforward, it is based on assumptions that can influence the adaptation. Particularly, the fuel share caters for huge change potential. The graph below shows the rate adaptation values based on the fuel price changes. For instance, if we applied diesel price changes of 40% as happened in early 2022, the rate adaptation would vary between 8% and 14%, depending on the applied fuel share. One might argue that the spread between a 20% and 35% fuel share is substantial, but this range represents the potential fuel share variation of an European network.
According to our Market Insights cost model, a German domestic transport with a distance of 300 km has a fuel share of roughly 21%, while a transport from Poland to Romania with 1200 km has a share of 34%.

Source: own illustration
Therefore, a flat fuel share, such as e.g. 25 %, as applied by many shippers at European level, represents an average, whose price adaptation might not accurately reflect the real changes. Therefore, it is important to ensure that this average value aligns with a shipper`s network. This might justify varying diesel shares based on distance or on specific corridors. Nevertheless, conducting a deep analysis of the shipper’s individual network is necessary for this.
Another issue with using a fixed diesel share, which typically is not updated by shippers, is that it doesn't adjust automatically when diesel prices change significantly. The fuel share should grow/fall with the diesel price, but for simplification, it remains fixed, leading to inaccuracies.
Additionally, our analyses have revealed that the choice of fuel price, whether derived from the EU27 average, or based on the origin country`s fuel price, can cause variations of up to 3% in the last years. This happened largely because selective national subsidies have influenced the EU27 average, while some national diesel prices did not follow the same pattern.
In conclusion, despite the potential inaccuracies, this approach provides an efficient way of handling the fuel costs - provided that the fuel share aligns with the shipper´s transportation network structure and it adjusts fairly in both directions for shippers and carriers. Additionally, there is still the opportunity of re-tendering the lanes and thereby resetting the fuel adjustment values to counteract potential detrimental developments.
The American Way of diesel change management
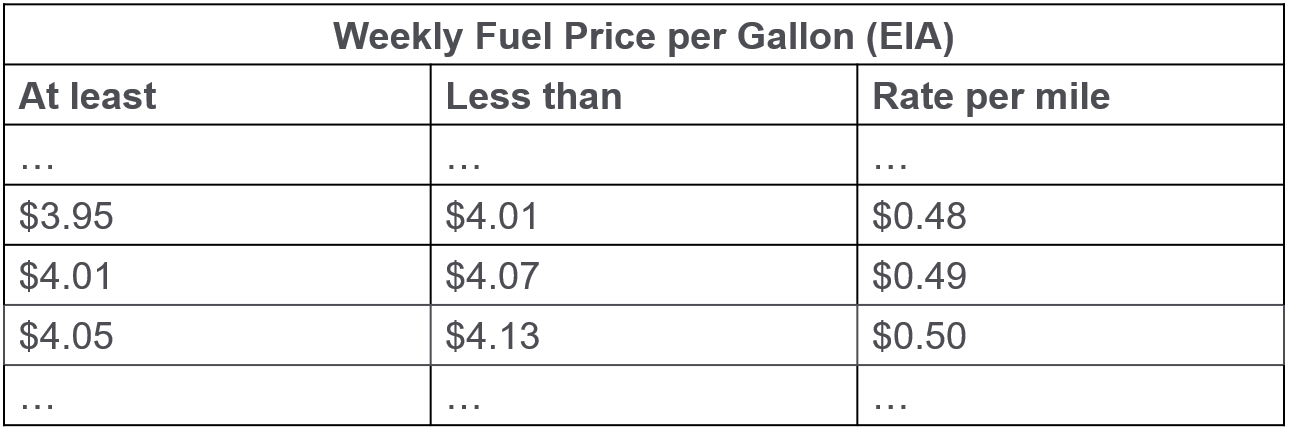
In contrast, fuel surcharges in the US are adjusted on a more granular level: the shipment level. Factors influencing these adjustments include the fuel index, the driven distance, and the truck`s fuel consumption. The widely used index is the weekly Diesel Fuel Update of the U.S. Energy Information Administration. (https://www.eia.gov/petroleum/gasdiesel/)
The distance is calculated for each route and a general fuel update table is agreed upon during tendering. Typically, this predefined table shows the fuel surcharge per mile depending on the reported diesel price. (see table) This allows even weekly updates.
Sample calculation for US market:

For this calculation, there is no hypothetical fuel share required. However, it does rely on a different overarching simplifying factor: the truck`s fuel consumption. Obviously, the consumption also varies in reality depending on the driven route, length of distance, loading/unloading factor. This can also entail discussion potential.
In addition, there needs to be consensus on the distance. In the US, route calculators like PC*Miler are generally accepted. Both parties agree on the version of the calculator to use, and then there are no open questions. Generally speaking, distance has a different significance in the procurement process compared to Europe, as rates are typically agreed upon a $/mile basis, making it necessary to agree on a specific distance. This essential information can also be used for the fuel floater handling.
In contrast, in Europe, the actual distance of a route is usually factored in by the carriers during their offer calculations. The shipper simply compares the all-in prices from all carriers, without needing to determine a specific distance. Furthermore, there are no widely accepted distance calculators like in the US, making such an approach more difficult and potentially leading to more discussions.
The US approach offers an opportunity to treat the base rate (rate excluding fuel) and the fuel component separately. This separation simplifies tracking the development of the base rate, makes negotiations easier by excluding diesel, facilitates rate updates based on general market indices, and simplifies the comparison of different carrier offers.
As you see, there are several advantages to this approach. However, it does require careful preparation, taking into account factors such as distance and derived surcharge rates.
Conclusion
After working with European and American customers, it's clear that European shippers take a more individualized and less standardized approach (considering factors such as fuel share, individual thresholds, frequency). In contrast, US shippers benefit from a more generalized approach, which helps automate processes related to fuel surcharge adjustments. This difference may stem from the IT tools used, as American shippers utilize different tools to manage and audit costs.
In conclusion, both methods come with their own set of pros and cons. The trade-off is between ease of handling and accuracy. The optimal method needs to ensure that the calculation values reflect the shipper´s network as closely as possible while remaining manageable. Many companies decide based on their IT-systems and the effort required for administration, implementation and automation. So if a system does not reflect the requirements in a sufficient way, the more inaccurate method will be chosen. This typically results in a solution that acknowledges some inaccuracies but still provides a fair level of security for all parties involved.
Thomas Hang
Lead Research Analyst