


Exploring the Paradox: High Truck Activity Amidst Lower Demand in Europe's Transport Sector
Market Monday - Week 38 - Driven Distance Market Indicator back on track

Ten weeks ago, I shared my last analysis of the Driven Distance Market Indicator, a Key Performance Indicator (KPI) used to assess demand and capacity trends. This KPI measures the total distance a truck covers in a month compared to the average of the past 12 months, based on real-time visibility data. The following chart compares this metric over the past two years.
European Truck Activity: Monthly Driven Distance Index
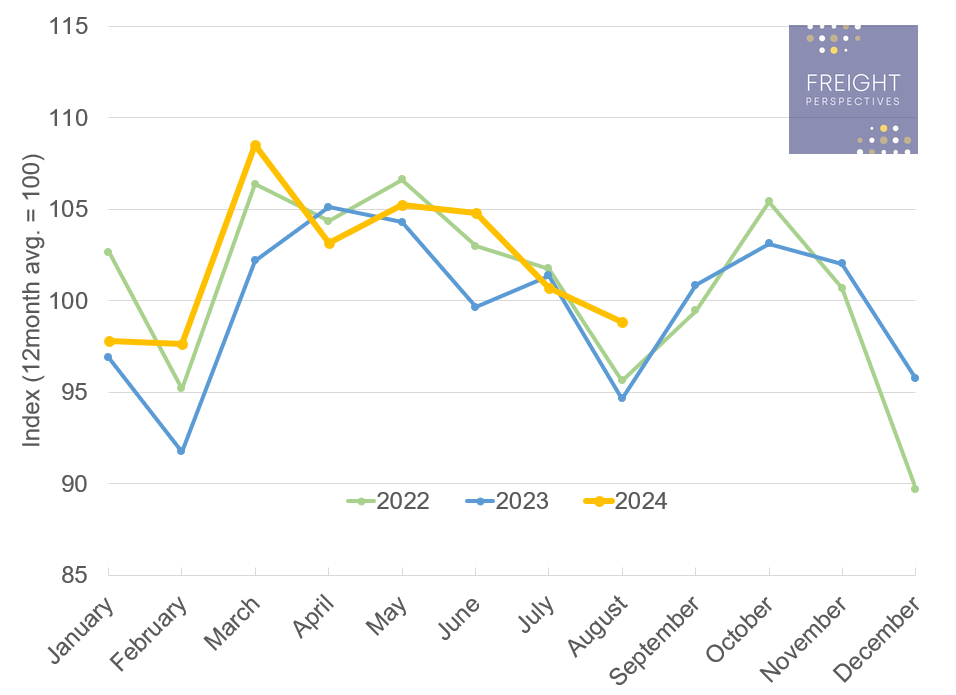
Source: Transporeon Real Time Visibility
Let's explore the European truck activity trends and their implications. Our Driven Distance Market Indicator provides valuable insights into the transportation sector. While we can't directly compare year-to-year values, we can identify meaningful trends. Values above 100 indicate higher monthly driven distance compared to the 12-month average, while values below 100 suggest lower monthly driven distance. Monthly values reveal trends over time, and two-year data helps assess seasonality.
In this context, European truck activity decreased in July and August, following the seasonal trend. However, it is noteworthy that July even downwards crossed previous years’ values. This trend is also reflected in our overall demand metric. In August, we can clearly see that activity exceeded previous years' values, and the overall demand tracked on our platform further confirms this development.
Implications and Conclusions:
Despite the unexpected decline in July, August's data and preliminary forward-looking indicators from the Transporeon platform suggest a robust recovery in truck activity. On the other hand, although the demand figures for August indicate a slight upward trend, this is significantly below the previously expected values. This, combined with the weak July values, indicates a delayed return to growth economy and transportation demand in Europe.
This leaves one question unanswered: Why are we still observing high truck activity?
In my opinion, two key factors likely contribute to this phenomenon. First, decreased overall capacity leads to increased production for trucks still in service. Second, network changes, coupled with potentially longer average transport distances, further impact the current situation.
In conclusion, the combination of reduced capacity and network adjustments appears to be driving the current high truck activity in Europe.
Christian Dolderer
Lead Research Analyst