


The Rise of Slow Steaming in European Road Transportation: Adapting to Changing Demand
The Rise of Slow Steaming in European Road Transportation: Adapting to Changing Demand

In 2023, Europe experienced a peak in available capacity, providing sufficient trucking capacity throughout the year with decreasing rate levels. When comparing this situation to similar ones in the ocean container market, the introduction of slow steaming was often a reaction by ocean carriers to reduce costs and mitigate market overcapacity. Therefore, it raises the question of whether it could have a similar impact on European road transportation. If so, a significant shift and reduction in average velocity, as well as a decrease in demand for transportation, would be the basic assumptions to be confirmed.

To assess the demand for transportation, we analyzed transaction data on the Transporeon platform over the past years. As expected, there is a clear drop in demand in 2023, in line with the currently weakened economy.
European demand for transportation
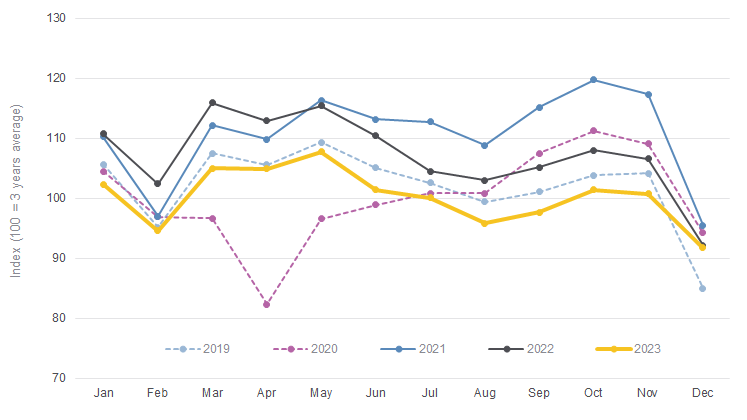
Source: Transporeon Transport Execution Platform data
The highest demand for transportation in the past 5 years was observed in 2021 and the first half of 2022. In 2023, demand followed the usual seasonal developments but at considerably lower levels.
Next, we analyzed our real-time visibility data in Europe to confirm or dismiss the second basic assumption of decreased velocity in European truck transportation.
The analysis results confirm this assumption. The median velocity in 2021 was 73.7 km/h, which was 4% higher than in 2023 (70.8 km/h). Although the median velocity in 2022 (72.6 km/h) was slightly lower than in 2021, the fact that almost half of the year was already impacted by decreasing demand aligns with the theory.
The following chart shows the speed profiles of the three analyzed years, clearly illustrating a shift in distribution.
Velocity distribution European road transportation
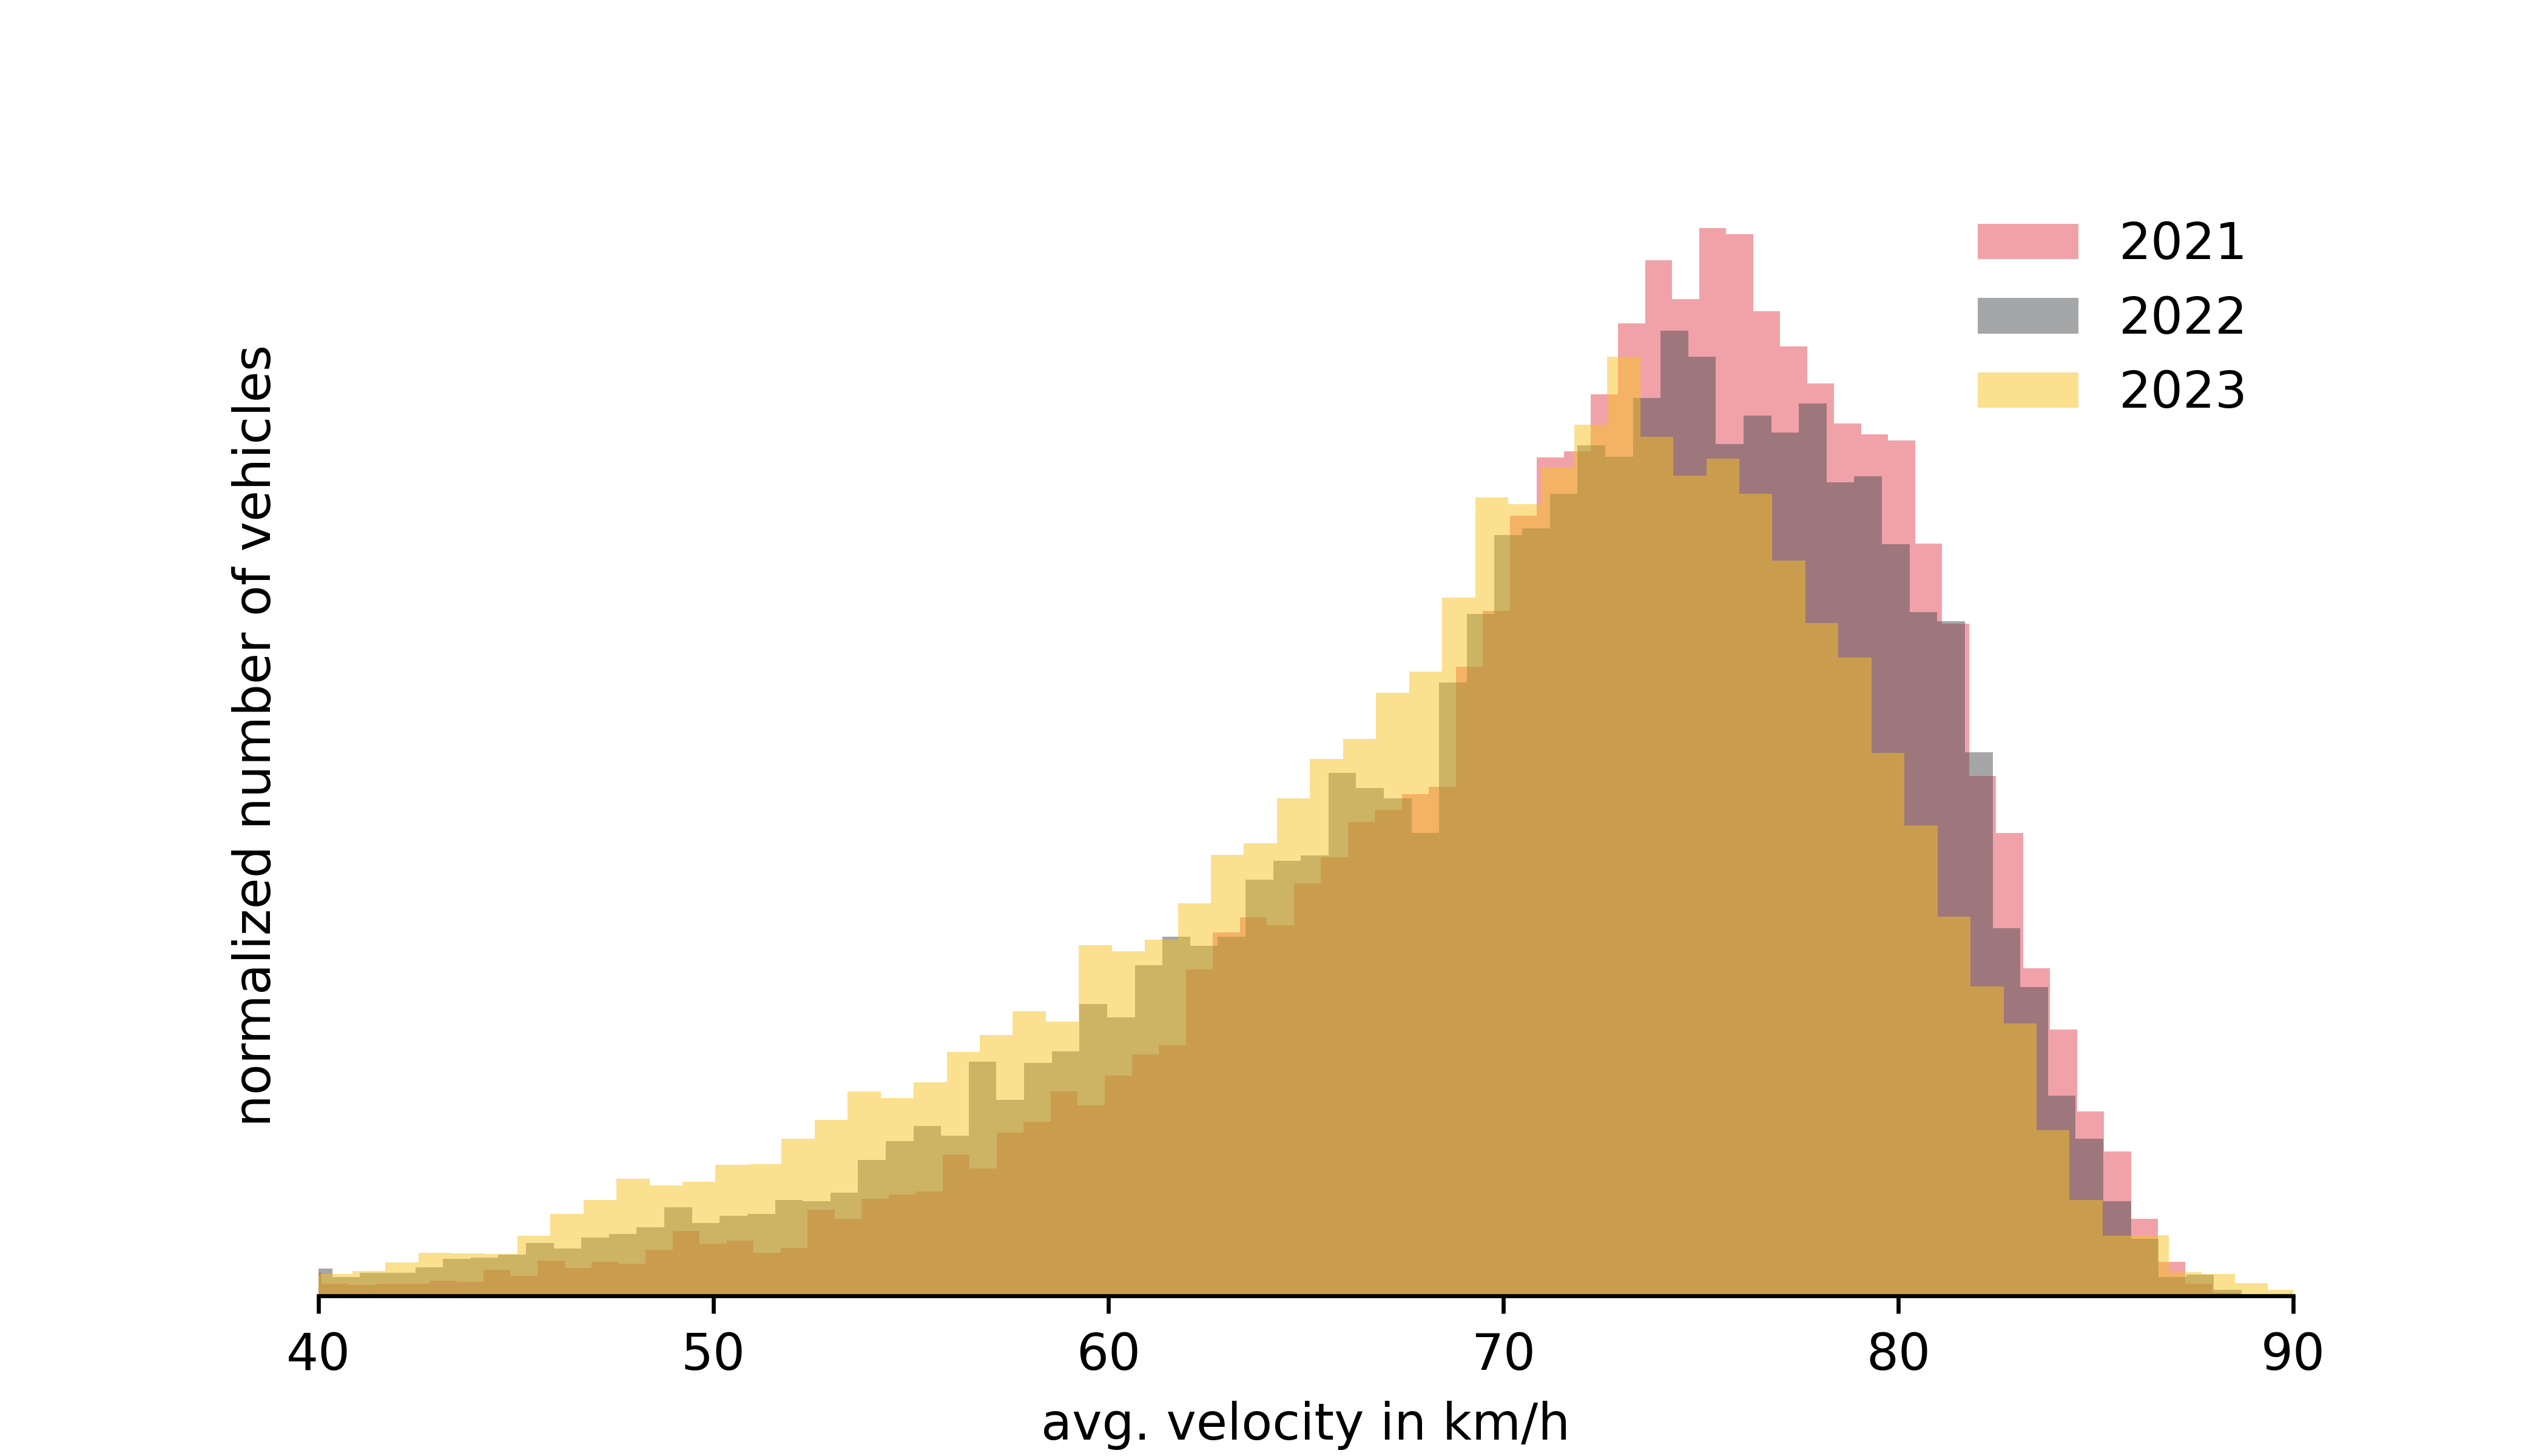
Source: Transporeon Real-time Visibility data
We then combined the demand data with the velocity data. To do this, we calculated the correlation between each bin (rectangle with average speed per month) and the demand indicator. The resulting map shows the correlation between velocity and demand.
Correlation between speed reductions and demand reductions
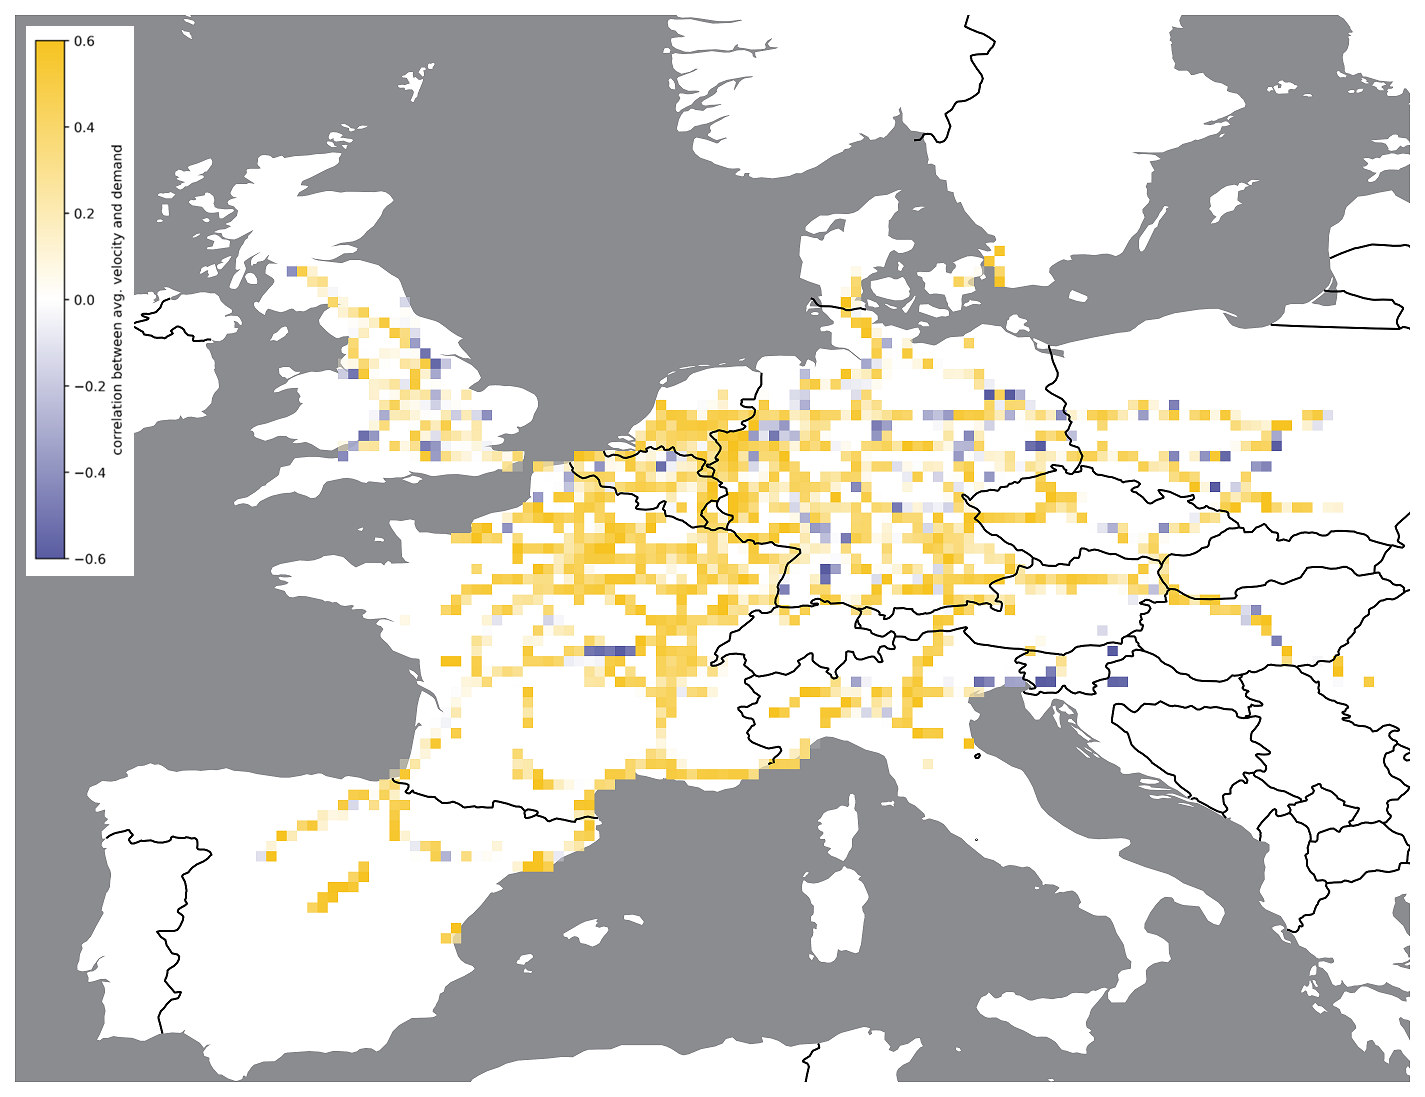
Source: Transporeon Transport Execution & Real-time Visibility
Main transport corridors became visible when filtering areas with high numbers of active trucks. The strong correlation (yellow) between lower speed and low demand for transportation is evident across Europe. Single blue spots (higher velocity at lower demand) can be explained by factors such as the completion of construction works or measures/actions to increase traffic flow. Additionally, political impacts, such as Croatia joining the Schengen area in 2023, led to fewer traffic jams and disruptions at its borders, resulting in higher average velocity.
If we continue with the theory that these observations can be attributed to slow steaming, we also need to evaluate the potential effect of other factors that could cause such a development, such as increased or longer loading/unloading times or construction works based traffic jams. These factors can also decrease and shift the velocity as monitored. However, the distribution of the yellow rectangles throughout Europe strongly indicates that this is not the case. Since speed is calculated within individual rectangles, we can rule out disturbances at loading/unloading sites and construction works, as these would have needed to occur almost everywhere in 2023, which is highly unlikely.
What does this mean for the road transport market?
Returning to the initial question of whether slow steaming in truck transportation is a measure taken by European carriers to mitigate low demand and decreasing rate levels, the answer is likely yes, as a clear effect in this direction can be observed.
However, we cannot compare it to the ocean market because slow steaming in road transportation does not jeopardize transit times and reliabilities as it does in the ocean sector. It is a possibility to slightly mitigate the effects of demand and provide drivers with a less hectic work environment, which is valuable in the era of overall driver shortage. On the positive side, this also means that the available capacity in the market is even higher than initially expected. In a future phase of increasing demand, it is also possible to increase speed again and perform more transports within the market using the same number of trucks. Another benefit is that this higher utilization of trucks will help mitigate price increase peaks on the spot market if demand picks up again.
In summary, although slow steaming influences the road transport market, it does not have the same extent of impact as in the ocean market. Slow steaming in road transportation is seen as a natural reaction or consequence of the market, ensuring that fundamental market dynamics remain in play. This is made possible by the polypolistic market structure in European road transportation.